
Table of Contents
A new chart for interviews and guest spots
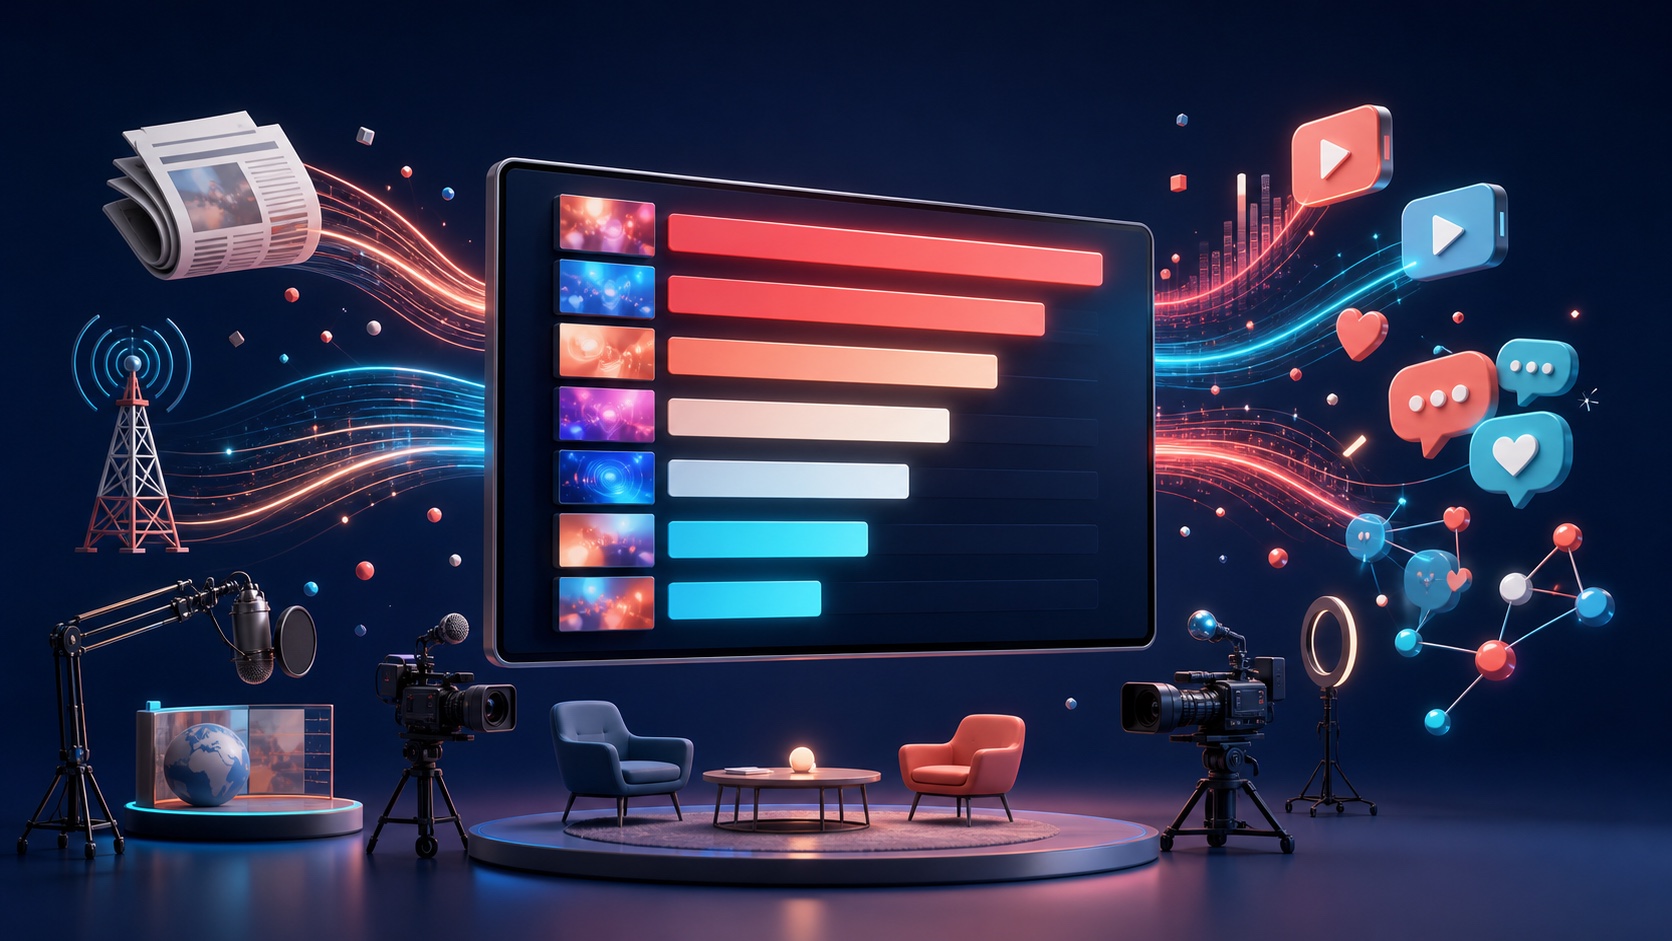
Tom Cruise, in South Korea to promote the film Digger, sat down for an interview on singer Sung Si-kyung’s YouTube channel. In the week that interview drew attention, the “SUNG SI KYUNG” channel placed second in Good Data Corporation’s first web non-drama buzz ranking. Its buzz score rose 28.7% from the previous week, the channel’s best result since August. On top of the view counts on the channel itself, the interview now had a place on a chart that compares the attention a show gets outside its own page.
Third place went to “TEO_Salon Drip,” where an episode with ATEEZ members Wooyoung and San stood out. Its buzz score rose 38.8% week over week, also its best since August, and it placed second in both the video and social media categories. Two shows with different guests were measured over the same week with the same indicators. That makes it possible to compare not only what each program released but what kind of response it got afterward.
The results come from the “web non-drama buzz” survey for the third week of October 2026, published for the first time on October 22 through Good Data’s FUNdex service. “Web non-drama” means unscripted programs made for the web, and the survey starts with major YouTube variety programs and channels. It covered October 12 to 18. The individual rankings matter less than the change behind them: buzz analysis, long used for TV and streaming, now covers YouTube too.
Ratings count viewers; buzz counts the conversation
Korean entertainment news cites two numbers that answer different questions. Ratings show the share of households or people who watched a program at a given time. Buzz measures how much attention a program generates in news coverage and online. Ratings are about the act of watching; buzz is about the information and reactions a show produces. The same program can look quite different depending on which number you read.
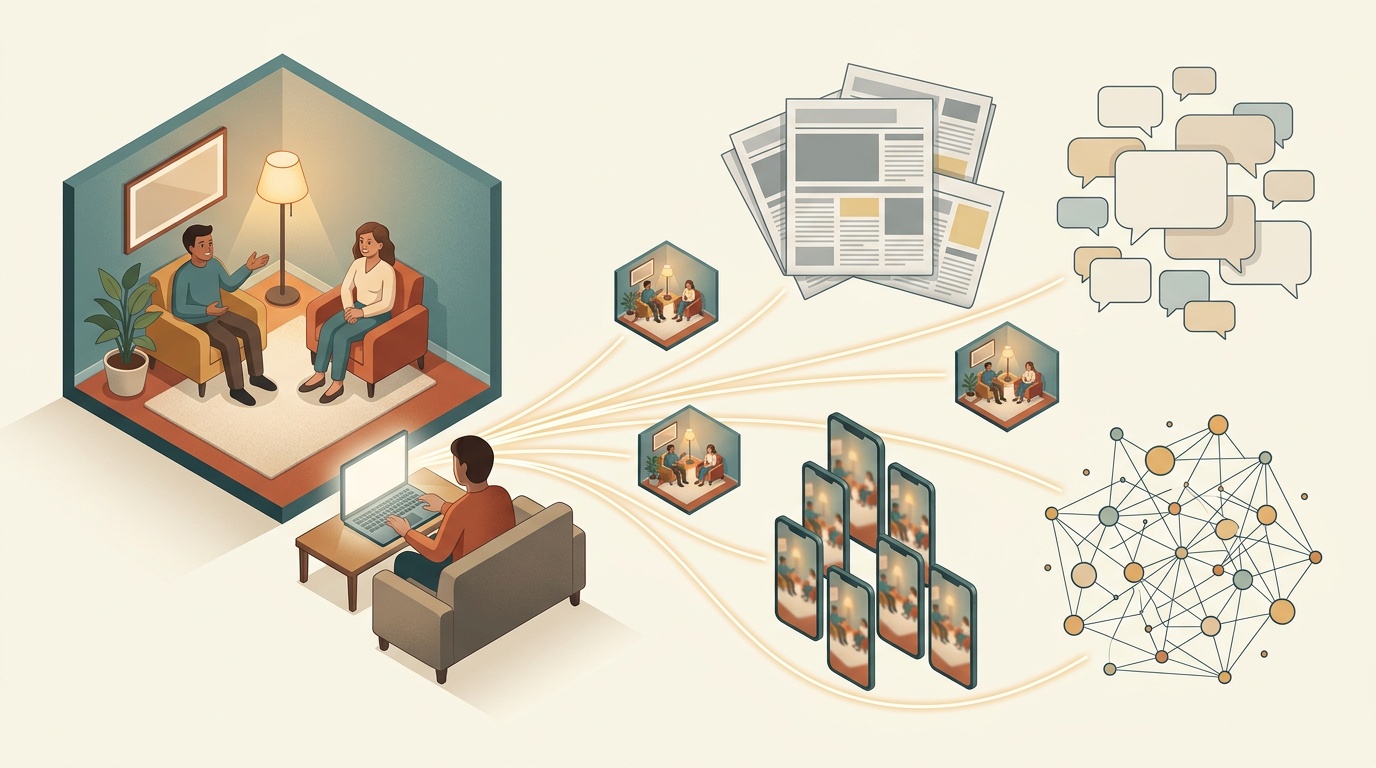
This survey analyzed news articles, VON (Voice of Netizen, meaning online reactions from users), video clips and Shorts, and social media. That covers far more ground than counting plays of a single video. A program written up in the press, a guest people are talking about online, a scene that resurfaces as a short clip: all of these fall inside the survey. The approach looks at how information about a program is produced and how people respond to it, across several types of data.
That difference is why the industry pays attention to buzz. For producers, it is a clue to whether a show keeps people talking after they finish watching. When promoting a program or checking how a guest landed, it gives a point of comparison that ratings and view counts do not. Buzz does not directly measure viewer satisfaction or revenue, though. Whether attention was generated, and what that attention led to, are separate questions.
Some shows lead in the news, others on social media
The first overall No. 1 was “Hello, This Is Woni, Nice to Meet You” (shortened to An-Won-Jal-Bu), a variety show built around Woni of the girl group RESCENE, with buzz up 57.4% from the week before. Places four through ten went to Chimchakman, Bulkkot Yagu 2 (Flaming Baseball 2), Workman_Workdol, No Ppakku Tak Jae-hoon, SoUp: Studio fromis_9, Jjanhanhyeong Shin Dong-yup and DdeunDdeun_Pinggyego. With these channels and programs on one table, readers can see where attention went among the surveyed shows without visiting each channel.
The category results tell a different story. Bulkkot Yagu 2, fifth overall, ranked first for news buzz, while “Idol Human Theater” ranked first for social media buzz. The program that drew the most press coverage was not the one people talked about most on social media. The overall table combines several kinds of response into one position; the category results show where the attention came from. Under the same word, “popular,” press focus and user reaction can look quite different.
That affects how the rankings should be read. The overall order tells you which program came out ahead, but not where it was strong. Reading the category results alongside it gives a more detailed view of the attention around each program. It treats a variety show as more than one episode, following it through articles, short clips and posts. The analysis extends beyond the screen where the show is watched.
TV in 2015, streaming in 2022, the web in 2026
Good Data has widened its coverage in stages. It began measuring buzz for TV programs in 2015 and added streaming originals in 2022. This year’s web non-drama survey brings YouTube variety into the analysis. Areas that used to be separated by where a program premiered are being placed under a common way of measuring response. The announcement does not discover YouTube variety so much as extend an existing analysis system to cover it.
In the same period, MBC’s “Rookie Director Kim Yeon-koung 2” topped the TV and streaming non-drama buzz ranking. Readers now see the TV-and-streaming ranking and a separate web ranking side by side. A table for YouTube variety has been added next to the one for broadcast and streaming shows. The two are not yet a single ranking, so the No. 1 on either list cannot be read as the leader across all platforms.
Won Soon-woo, CEO of Good Data Corporation, said the survey “laid the foundation for integrated analysis covering TV, OTT and YouTube.” He added that the company would “open an era of comparing and announcing the competitiveness of K-video content by a single standard, across platform boundaries.” The company plans to release an official integrated ranking in 2027. For now it is building the analysis for each area, with a combined comparison of content from different platforms as the next step. That explains the gap between expanding the survey and publishing a single ranking.

Deciding what counts as attention
Removing irrelevant data matters as much as collecting reactions. Good Data says it filters out material unrelated to a program and abusive data meant to inflate buzz scores on purpose. So a program is not credited every time its name appears somewhere online. That step decides what counts as attention to a given program. Buzz is a figure produced by collecting data and then sorting and excluding it by set rules.
The company says its analysis is more than 97% accurate. That is the company’s own claim, and it is not the same as saying every viewer reaction was captured. The survey covers web non-drama programs that are streaming or about to be released, along with their cast and guests, and the data comes from defined categories. To read the numbers well, it helps to look at the scope of the survey and its data alongside the accuracy claim. Knowing the conditions behind a result makes clearer what the figure actually describes.
Including programs that have not yet been released also shows what buzz is. People can talk about a program or its cast before anyone has seen it. A program already out can also draw new attention through articles or short clips. What the indicator tries to capture is attention to a program during a set survey week. Compared with ratings, which center on viewing at air time, it can also reflect the response before and after a release.
A public top 10, and details for business clients
For the first survey, Good Data selected the major YouTube variety programs and channels to include, and it plans to widen the range over time. The current results are therefore a comparison among the selected shows. As the pool grows, the chart will describe a larger part of the field. Which programs are included is as important as the order they appear in, and readers should look at the scope of the table as well as the names on it.
The public web non-drama ranking goes only to the top 10. More detailed results, including buzz for individual cast members, are offered on the FUNdex B2B platform for business clients. The public table and the business data are not equally detailed. General readers can see where the top programs stand, but not the rankings below them or results for individual performers in the same depth.
That shapes how the public table can be used. Finding which programs reached the top and comparing how a particular performer was received need different data. The public ranking alone cannot explain every difference between programs. At the same time, a top-10 cutoff condenses the week so readers can quickly see which programs stood out. A short table and detailed analysis serve different purposes, and the service now offers both, at two levels.
From a single upload to comparisons across platforms
As with the interview at the top of this piece, a YouTube variety show is released on one channel, but the attention around it does not stay there. Someone who reads an article or watches a short clip may carry the conversation somewhere else. The buzz survey gathers those scattered reactions back under each program. It places content people watched on one screen inside a wider flow of information. What the first web chart adds is that way of looking, more than a new set of ranks.
The next thing to watch is which programs the integrated comparison will include and how much it will disclose. TV, streaming and YouTube are watched in different places, but the reactions to them meet in news, video and social media. That is the starting point for analyzing them with common data. How widely each platform’s programs are included, and how much detail is made public, will remain conditions on any comparison. Being placed on the same table is one task; giving readers enough information is another.
The change is about more than who led the week. The language used to describe the popularity of Korean variety shows is moving past broadcast schedules and single channels. Readers now ask not only where a show was watched but what response it produced. Whether the new ranking becomes a standard tool for describing the industry will become clear as the survey widens and the integrated ranking arrives. The open question is how much a measure of the amount of attention can say about what kind of attention it is.
Sources: Media Today, October 22, 2026; Edaily, October 23, 2026; iMBC Entertainment, October 20, 2026.