Table of Contents
The Gap Between the Average and the Grocery Cart
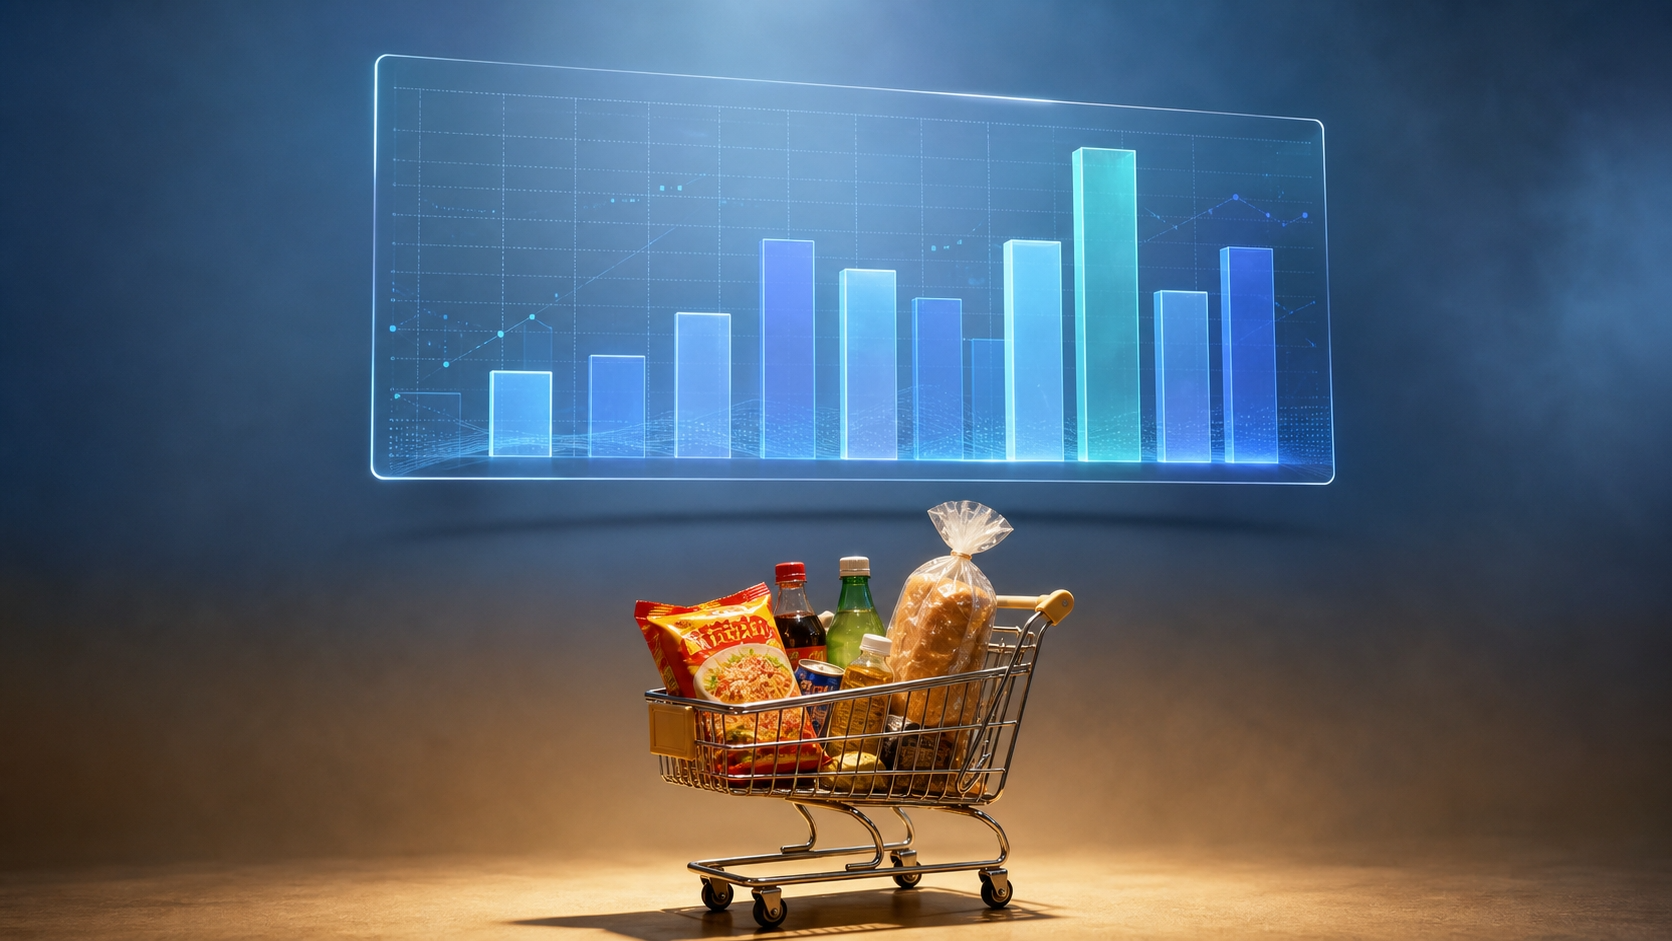
Korea’s consumer prices rose 2.8% in July from a year earlier, down from June’s 3.2%. Judging by the headline number alone, the pressure looks like it’s easing somewhat. But the landscape consumers walked into in August looks different. Ramyeon, bread, beverages, clothing, and appliance repair fees all started rising at nearly the same time.
The National Data Agency’s July living-cost index, which tracks frequently purchased, high-weight items separately, rose 2.5%. Even so, it doesn’t exactly track what any individual household feels. The average consumption basket and any one family’s actual spending structure are two different things.
The Items You Buy Most Often All Rose at Once
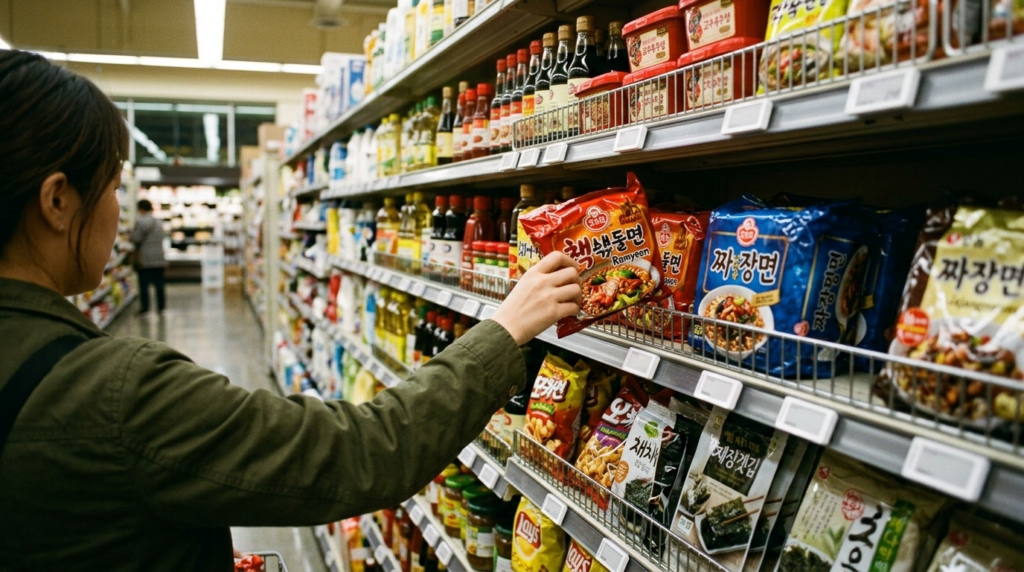
August’s price adjustments concentrated on repeat-purchase items. Nongshim raised prices on some cup noodles and snacks by an average of roughly 5%. The consumer price of Yukgaejang Bowl Noodles moved from 1,100 won to 1,200 won, and a 90-gram bag of Saewookkang went from 1,500 won to 1,600 won. Some bread, beverage, and frozen food prices followed the same pattern.
These aren’t items people buy once every few years, like a car or furniture. They’re products people check the price of at the convenience store or supermarket, often at lunchtime, every day. Even if their share of the overall CPI is limited, high purchase frequency means the price hike gets felt over and over. That’s where the statistical weight and the psychological weight start to diverge.
The Cost Increases Spread Beyond Food
This round of increases didn’t stop at food. Some apparel companies adjusted prices, citing higher raw material and logistics costs, and service fees for appliance repair and technician visits — TVs included — went up too. For households that had been cutting their food budget to protect other spending, the room to maneuver just got tighter.
Mandatory costs like national health insurance premiums compound the felt inflation as well. Unlike a product’s price, insurance premiums aren’t something a consumer can simply delay buying or swap for a cheaper brand. When more money is withheld from a paycheck before it even reaches a household, disposable income doesn’t rise as much as nominal wage growth would suggest.
Why a Raise Doesn’t Bring Relief
Households don’t experience the inflation rate itself so much as the gap between income growth and the growth of costs they can’t avoid. Even if pay rises 3%, if food, transportation, housing, and insurance — categories that are hard to cut — rise faster, living standards can still slip backward. It’s a similar dynamic to how, in the U.S., housing and medical costs, more than the average CPI, tend to drive felt inflation.
The timing of price hikes matters too. When companies absorb rising raw-material and exchange-rate costs for a while and then adjust prices around the same period, the annual average may smooth it out, but consumers take several hits within a single month. The term some Korean media use for this — “clustered price hikes” — describes the density of the increases more than their size.
Lifestyles Change First
Consumers are already responding with bulk buying, private-label products, and shopping during discount hours. Some are swapping restaurant meals for delivery or ready meals, then swapping those for home cooking again in stages. The problem is that not every household can cut back the same way. For dual-income households short on caregiving time, ready meals aren’t optional — they’re how time gets bought back.
What’s worth watching next isn’t just August’s overall inflation figure but processed food and dining-out prices, real wages, and household spending patterns. If prices for essentials and fixed costs keep climbing even as the average rate stabilizes, the recovery households actually feel will keep lagging behind the headline number. In the end, the distance between the statistic and daily life comes down to how much disposable income is actually left over.
Source: National Data Agency, “July 2026 Consumer Price Trends,” August 4, 2026; SBS, July 31, 2026; YTN, August 5, 2026.