

Table of Contents
44.1% and 56.2%: two numbers, one month
In August 2026, South Korea’s official youth employment rate, based on the standard 15-to-29 age bracket, stood at 44.1%. That’s down a full percentage point from the previous year, a 28-month consecutive decline and the lowest point since August 2020. But widen the same month’s population to ages 15 to 34, and the estimated employment rate jumps to 56.2%. Raising the upper age limit by five years added more than 10 percentage points.
The gap became a public debate after The Hankyoreh reported on September 10, 2026 that the expanded youth definition under the Special Act on Youth Employment Promotion would reshape employment metrics. The next day, the National Data Agency issued a direct rebuttal. The existing 15-to-29 metric isn’t being replaced, the agency said; it will be published alongside the new 15-to-34 metric. Reports suggesting youth employment rates would suddenly spike next month, it added, were simply wrong.
The job market didn’t change. The people being counted did
It would be a mistake to read the gap between the 15-to-29 and 15-to-34 employment rates as a real increase in jobs. Both metrics cover the same month, but they count different people. The 15-to-29 group includes many who haven’t fully entered the labor market yet: high school and college students, people completing mandatory military service. Expanding the bracket to 34 pulls in people in their early 30s, who are, as a group, far more likely to be working.
Employment rate is just the share of a given age group that has a job. Add an age bracket with a different employment reality and the overall average shifts, even if not one new job was created for the original group. A higher rate for the 15-to-34 bracket doesn’t mean job prospects for people under 29 suddenly improved. It reflects the math of folding in an older, more settled group.
That’s why the denominator matters as much as the percentage. Neither 44.1% nor 56.2% is wrong. The first captures how hard it is for people in their 20s to break into the workforce; the second reflects the employment status of the full, legally defined youth population. They’re simply answering different questions.

The 15-to-29 metric tracks the struggle to break in
The traditional 15-to-29 metric’s main value is tracking the transition from education to work, a vulnerable stretch for anyone going through it. This age group mixes first-time job seekers, full-time applicants, and students juggling classes with job hunting. When the employment rate drops or unemployment climbs here, it’s a clear sign that young people are hitting steeper barriers to their first real job.
In August 2026, the unemployment rate for the 15-to-29 group rose to 5.4%, up half a percentage point from the year before and the fourth straight month of increases. Employed people in this group numbered 3.428 million, down 143,000 from a year earlier. Another 395,000 young people reported they were simply “resting,” with no primary activity. These numbers explain why the hurdles twenty-somethings face need to be tracked on their own.
Rely only on the 15-to-34 average, and the relative stability of early-thirties workers can mask how badly people in their 20s are struggling. Rely only on the 15-to-29 bracket, and you leave out the early-thirties group that many government youth programs actually target. Publishing both side by side is a reasonable compromise: it keeps the historical data intact while showing the full picture of who these policies are meant to help.
Employment statistics and youth policy serve different goals
There’s no single age limit for “youth” in South Korea because different systems were built for different purposes. The monthly employment report measures labor market shifts against a consistent baseline. Change the age range abruptly and it becomes hard to compare today’s numbers with the historical record, mixing the effect of a redefinition with actual shifts in hiring.
The Framework Act on Youth cares less about statistical consistency and more about who needs policy support, and what the state and local governments owe them. The law defines youth as ages 19 to 34, but leaves room for other laws and ordinances to set their own criteria depending on the policy. Wealth-building programs like the Youth Future Savings Account were built around this 19-to-34 range.
That the policy definition of youth runs wider than the statistical one reflects a plain reality: even after finding work, people in their early 30s still struggle with housing independence, building savings, and landing stable careers. The employment report isn’t deciding who gets policy benefits; it’s measuring labor market trends. The law and the data can both use the word “youth” and still mean different things, because they’re built for different jobs.
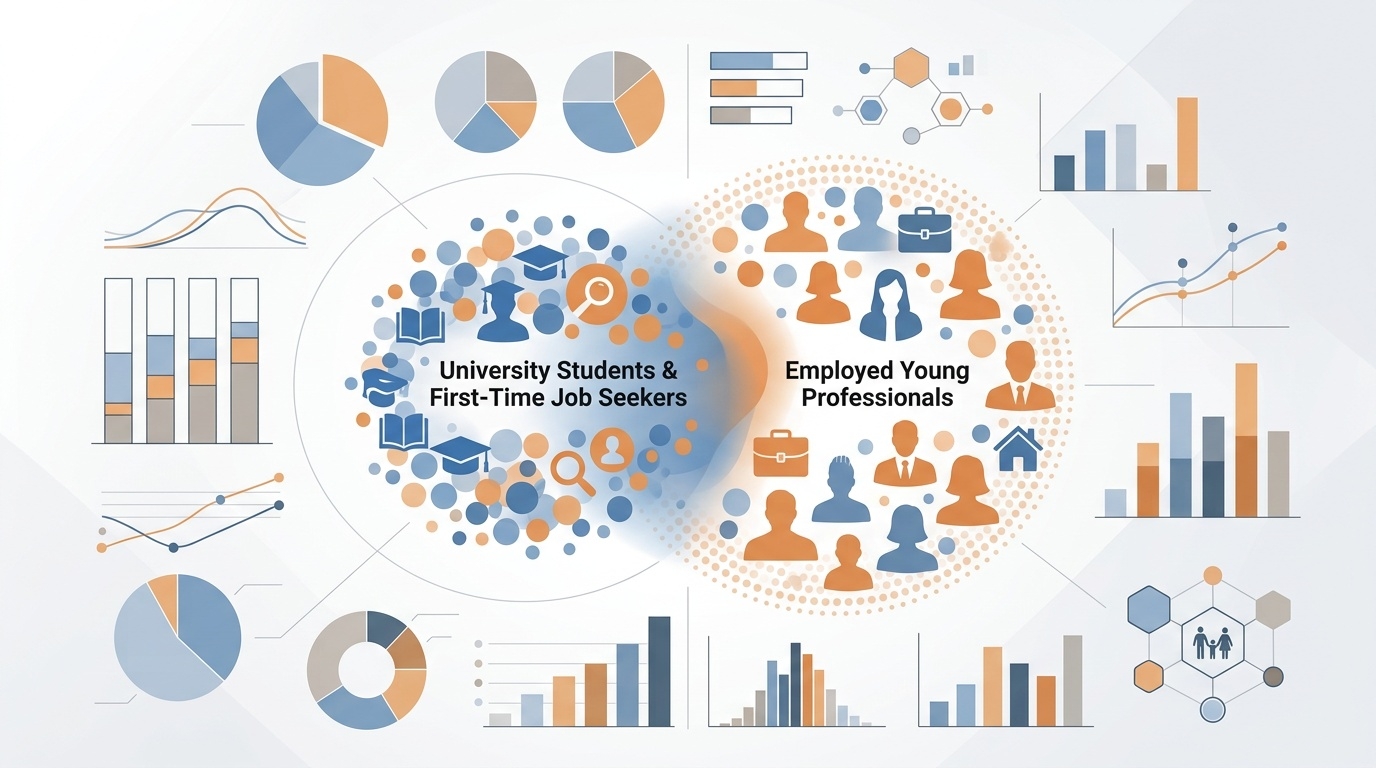
A law changes, and the data follows
Starting September 18, 2026, the legal definition of youth under the Special Act on Youth Employment Promotion expands from 15-to-29 to 15-to-34. The law’s focus is expanding job opportunities and hiring for young adults. As it brings people in their early 30s under its policy umbrella, the government needs new data to track how that wider group is actually faring.
In response, the National Data Agency said it would begin publishing 15-to-34 employment indicators starting next month. But wary of public confusion and mindful of keeping historical comparisons intact, it is keeping the 15-to-29 baseline in place. The official youth employment rate isn’t being overhauled, and the old numbers aren’t disappearing from future reports.
With both datasets running side by side, it matters to keep the names and age ranges straight. The 15-to-29 figure stays the tool for comparing historical trends among people just entering the workforce, while the 15-to-34 data covers the full group the expanded employment law is meant to serve. If media outlets and policymakers don’t specify which benchmark they’re citing, the same month can end up telling two very different stories.
Beyond 34: the push toward 39
The debate over defining youth doesn’t stop at 34. The Office for Government Policy Coordination is launching a study to reconsider the youth age bracket and how these limits are managed across different policies. It will weigh keeping the current baseline, raising the upper limit, or applying age criteria flexibly depending on the policy. The underlying question is how to update government standards for a society where getting a job, getting married, moving out, and building savings are all happening later than they used to.
In the National Assembly, some Democratic Party lawmakers have proposed legislation to raise the youth age limit by one year annually until it reaches 39. Pushing the limit to 39 was debated under the previous administration too, but stalled for lack of social consensus. Widening the age bracket lets more people qualify for support, but it also raises the question of how to divide limited resources across generations and programs.
Reading youth employment in South Korea now starts with a different question: not what the percentage is, but who the statistics count as “youth.” The 15-to-29 and 15-to-34 brackets are two different lenses, one on labor market entry, the other on a legally expanded policy target. With both numbers now published side by side, the risk to watch for is mistaking a shift in definition for a shift in the job market.
Sources: National Data Agency, “August 2026 Employment Trends,” September 9, 2026; The Hankyoreh, September 10, 2026; National Data Agency, “Youth Age for Employment Trends Remains 15-29, 15-34 Statistics to be Added,” September 11, 2026; National Law Information Center, Framework Act on Youth and Special Act on Youth Employment Promotion.